


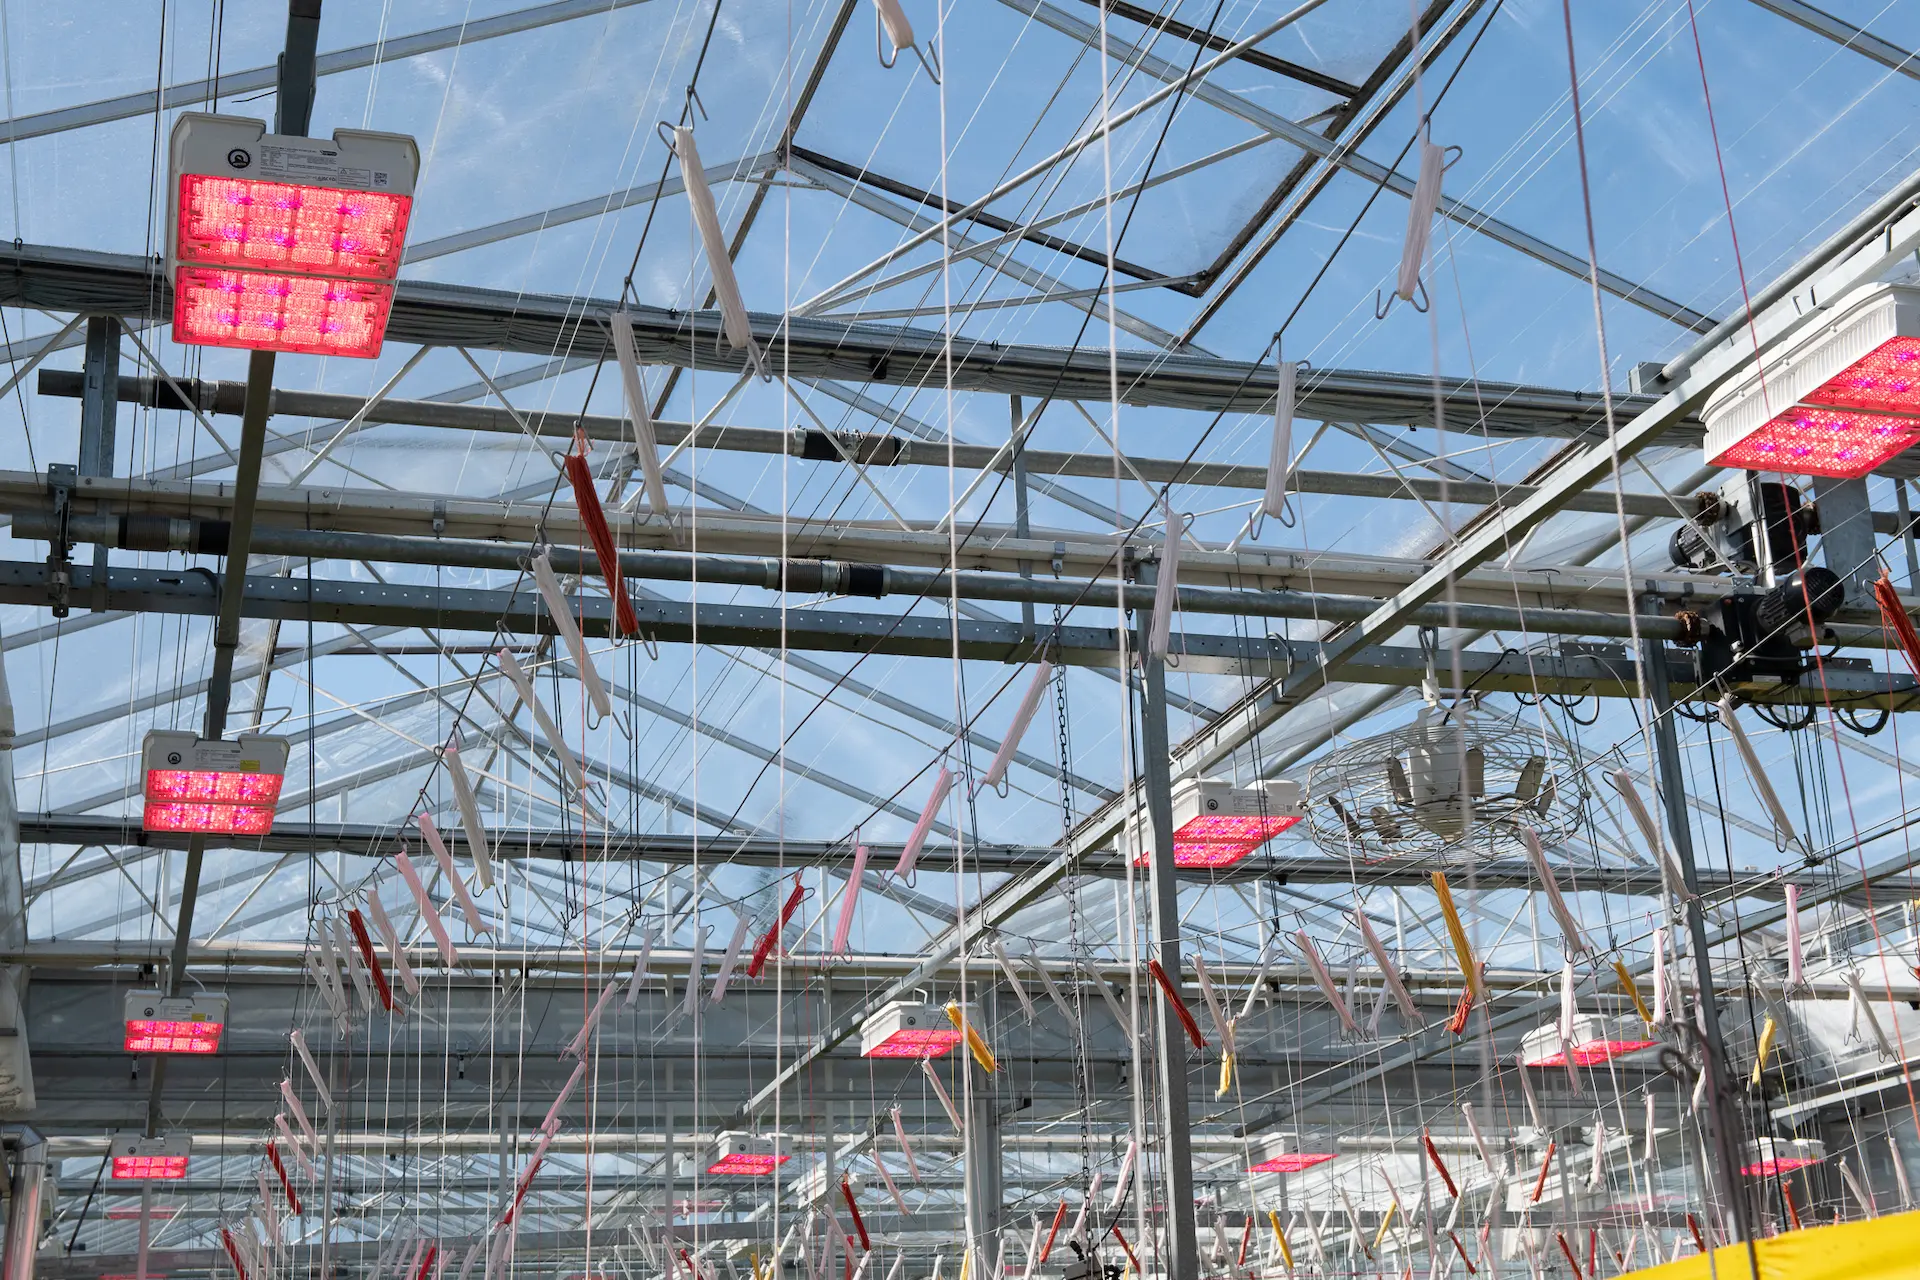
You can judge how your greenhouse lighting system is performing over the long term by comparing measured light output, energy use, and crop results with your original baseline. Regular PPFD measurements, power readings, and crop records show how the system is ageing. This works best when you track the same points, in the same way, year after year.
Results differ between crops, greenhouse structures, daylight conditions, and lighting technologies. Below, we cover which measurements to track, what causes decline, how often to audit, how to connect light to crop results, when to retrofit, and which tools support continuous monitoring.
Which metrics show how a lighting system is ageing?
The most useful metrics are PPFD at crop level, light uniformity, electrical power use, and the efficacy of the lighting system. When you compare them with the values from commissioning, they show whether your fixtures still give the crop the light it needs at an acceptable energy cost.
Start with the definitions, because they are easy to mix up. PPFD (Photosynthetic Photon Flux Density) is the number of light particles the plants can use that reach one square metre each second, measured in µmol/m²/s. DLI (Daily Light Integral) is the total amount of this light received over 24 hours, measured in mol/m²/day. PPFD tells you what the lamps deliver at one moment. DLI tells you what the crop actually received, including natural daylight.
These are the measurements worth tracking:
- PPFD at canopy height: Measure at fixed grid points and compare with your original lighting plan.
- Light uniformity: Lower light levels at the edges or under certain rows can signal local problems before the average drops.
- Power consumption: A rise in power use at the same dimming level can point to driver or electrical issues.
- System efficacy: This is the light delivered per unit of electricity. With HPS, it also shows how lamp ageing affects output.
- Spectrum, where relevant: Check that the spectral output still matches the specification, especially with LEDs that have a tailored spectrum.
- Failure rate: Note failed fixtures, lamps, drivers, and connectors by location.
Record the starting values at commissioning. Without a baseline, you can only guess how much the system has changed.
What causes greenhouse lighting performance to decline over time?
Performance usually declines because of gradual loss of light output, dirt on fixtures and reflectors, ageing components, and changes in the greenhouse itself. LED output slowly falls as the light source ages. HPS lamps lose output with burning hours and need regular replacement.
Fixture-related causes
LED light output declines gradually. How fast depends on operating temperature, drive current, and component quality. Drivers can age faster than the light source and may limit the overall lifetime. With HPS, lamp output decreases with burning hours, and reflectors can lose reflectivity over time.
Dust, condensation, pesticide residues, and algae can also build up on lenses, covers, and reflectors. In a humid greenhouse, this can lower the light reaching the crop even when the fixture itself works well.
Greenhouse-related causes
The environment around the fixtures changes too. Dirty or ageing greenhouse glass alters how much daylight reaches the crop. Screens, crop height, canopy density, and layout changes all affect how much light reaches the leaves. A system that performed well in year one may not suit a changed cultivation setup.
Moisture, heat, and cleaning methods also affect cables, connectors, and seals. These horticultural lighting maintenance factors are often overlooked until a fault appears.
How often should growers audit their lighting system?
Most growers benefit from a full greenhouse lighting audit once a year, plus a lighter check at the start of each lighting season. The right frequency depends on your technology, crop cycle, operating hours, and how much your production depends on consistent light.
A practical schedule looks like this:
- Before each lighting season: Inspect fixtures visually, clean lenses and reflectors, check connections, and note failures.
- Annually: Carry out a full PPFD measurement in the greenhouse on a fixed grid, compare it with the lighting plan, and review energy data.
- After changes: Measure again after a new crop, a changed layout, new screens, or repairs.
- When symptoms appear: Audit sooner if you see uneven crop growth, rising energy use, or more fixture failures.
Use the same instrument, the same heights, and the same measuring points each time, and calibrate your sensors on schedule. Inconsistent methods can create differences that look like ageing but are really measurement error.
How do you link light performance to crop results?
Record light data alongside crop data, then look for patterns over several cycles. Compare the PPFD and DLI your crop received with its growth, development, quality, and yield, always for the same crop, variety, and growth stage.
Light is only one factor. Temperature, CO₂, irrigation, nutrition, and daylight all influence results. To see the effect of lighting more clearly, keep records for each greenhouse compartment and compare like with like.
Log DLI per compartment, combining natural daylight and supplemental light, and note the photoperiod, since lighting hours need to match the crop’s biological requirements. Then track crop indicators such as growth rate, truss development, fruit set, quality, and yield timing. Comparing compartments with different fixture ages or conditions can also be revealing. Look at trends across several seasons rather than reacting to a single cycle.
Crop requirements vary widely between tomatoes, cucumbers, strawberries, leafy greens, and ornamentals. Set targets with your agronomist rather than relying on generic numbers.
When is it time to retrofit or replace fixtures?
It may be time to retrofit or replace fixtures when measured light levels no longer meet crop needs, maintenance costs keep rising, or your cultivation and energy situation has changed. The decision should rest on performance data, grow light lifespan, and total cost of ownership, not on age alone.
Signs that point towards action include:
- PPFD at canopy level is consistently below the design target.
- Uniformity has worsened, and cleaning or repair does not fix it.
- Failures are frequent and concentrated in certain zones.
- Spare parts or lamps are getting harder to find.
- Your crop mix, greenhouse layout, or production goals have changed.
- Electricity prices or retailer requirements have changed what you need from the system.
Replacing every fixture is not always the answer. Sometimes you can replace drivers, lamps, or reflectors, add controls, or upgrade only certain zones. Modular designs make partial upgrades easier because structural parts can stay in place while the light source or electronics change.
Weigh the full picture: greenhouse lighting energy efficiency, heat distribution, investment, and maintenance. LED is not automatically the best choice in every situation, and HPS may still suit some greenhouses, particularly where its heat contribution is valuable. The right choice depends on your crop, climate, and energy prices.
What tools help track lighting performance continuously?
Quantum sensors, energy meters, and lighting control software can all help you follow performance continuously. Together they support greenhouse lighting monitoring that can show changes in light output, energy use, and fixture status before they affect the crop.
Useful tools include:
- Fixed PAR or quantum sensors: These log light levels at crop height and outside the greenhouse, which supports DLI calculation.
- Handheld PPFD meters: These are used for periodic grid measurements during audits.
- Sub-metering for power: Measuring electricity per compartment shows changes in consumption.
- Control and monitoring software: Systems that record dimming levels, operating hours, and fixture status make trends visible. Not every control system supports every function, so check what yours records.
- Climate computer data: Combining light, temperature, and humidity records helps you interpret results.
Continuous data does not replace periodic measurements at the crop. Sensors can drift or become shaded, so check them against calibrated handheld readings from time to time.
How Agrolux can help with lighting system evaluation
We support growers in evaluating how their lighting system performs and in deciding what to do with the results. We start from your crop, greenhouse, and cultivation goals, and combine technical measurement with agronomic knowledge.
Depending on your situation, we can help with light measurements, comparing current performance with a lighting plan for your crop and structure, and linking light data to crop performance. We can also advise on upgrades, retrofits, or combinations of LED and HPS, including modular options such as LYRA™, where reusable structural components can reduce the need to replace complete luminaires. Support with managing light, energy, and data across your greenhouse is available as well.
If you would like to talk about how your current lighting system is performing, our specialists are happy to look at your greenhouse, crop, and lighting requirements with you. You can contact the Agrolux team or browse our portfolio to see how we approach different greenhouse projects.
Related Articles
- How can growers adapt greenhouse lighting during cloudy weather?
- What is light-sum control in greenhouse lighting?
- What should growers consider when upgrading an existing greenhouse lighting system?
- How can greenhouse growers optimise lighting during high electricity prices?
- How does luminaire ageing affect light output and efficiency?